Description of Implementation
Modeling Real-World Experiments
As I have mentioned, the class I am conducting my action research in is an integrated algebra II and statistics class. In phase two, we switched the curriculum from algebra to statistics and began with a new unit on experimental design. I began phase two explaining the various characteristics of experimental design; e.g. sampling, basic principals, and special design models. The data from phase one suggested that the modeling of problems was successful for student learning. Based on these findings, I wanted to model as many examples as possible for the students. Therefore, I showed students real world examples of experiments: e.g. Milgrams' obedience study, Stanford prison experiment, and several experiments that were highlighted on 60 minutes (two example videos provided below) in addition to experiments that we designed in class. Students were asked to identify the key characteristics of each experiment; for example, treatments and response variables so that they would be able to write their own experiments. Based on individual conversations and student responses to my feedback forms I found that students enjoyed looking at the real world examples because they were able to see experiments that had been conducted by practicing scientists. Furthermore, students were able to see experiments that addressed relevant topics in their lives; underage drinking, effects of sugar, and the ethical dilemmas behind certain social experiments.
|
This video is on the Stanford Prison Experiment. The video is intended to show students a real-world, and controversial, example of an experiment intended to measure human responses to obedience.
|
|
|
This video is an experiment conducted by a doctor at UC Davis attempting to measure the effects of sugar. The experiment is a real-world example of a situation that affect youth today; sugar intake and its link to health problems.
|
|
Quick-Writes
After the students were shown several real world experiments, they were given a series of "quick writes" where they explained in their own words how they would design an experiment based on a given scenario. For example, during one quick write students were asked to design an experiment that tests the effects of texting on a cell phone while driving. They were required to describe in detail how they would conduct this experiment using the principles of experimental design; randomization of treatments, replication, and the use of a control group. During the quick writes, students worked collaboratively in their small groups for approximately twenty minutes. After students were given time to collaborate, as a class, we went over student samples in order to show strengths and weaknesses when writing experiments. Each quick write was intended to strengthen students abilities to design their own experiments and prepare them for an individual assessment that would be given on experimental design (see experimental design assessment).
Student Collaboration
In phase two, during the quick writes students worked collaboratively when designing their experiments. For example, during the texting and driving quick write students discussed, in their small groups, ideas on how to properly design experiments but at the end of the quick write students turned in their individual work. This was intended so that I could continue to monitor students abilities to collaborate; and additionally, evaluate students abilities to transfer their learning from a collaborative to individual setting. My observations of the students and recordings in my personal journal showed that a good amount of students were disengaged during these collaborative in-class assignments. I found myself battling to keep kids on task and focused on discussing the assignment. Furthermore, students who excelled with algebraic calculations were disengaged because they said statements like, "I don't like all this writing" and "I prefer to calculate stuff."
Individual Assessment
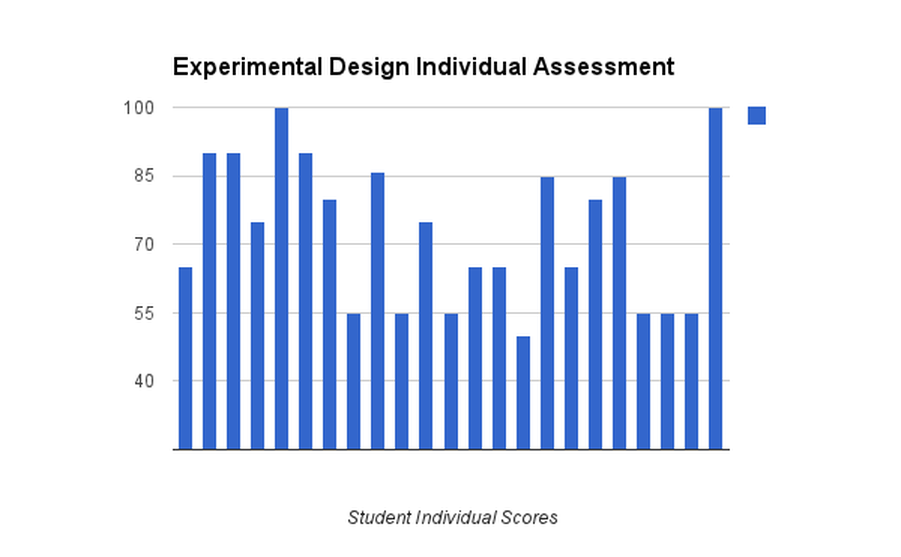
During the implementation of phase two, students were given an individual assessment on experimental design so that I could evaluate their ability to transfer their knowledge from a collaborative to individual setting (see experimental design assessment). Data analysis of the individual assessment test scores showed that students struggled on the individual assessment because they had difficulties designing their experiments; i.e. proper use randomization of treatments, replication, and use of a control group. In addition, several students struggled to properly implement a simple random sample. Scores on the individual assessment ranged from 50 to 100 (see experimental design scores below). My observations of the students and the analysis of the individual assessment showed there was disengagement among the students during the experimental design portion of phase two and students struggled to transfer their learning from a collaborative to an individual setting.
I have included samples of student successes and struggles in a slideshow below. A comprehensive look at student results on the individual assessment are given in the exp design student work pdf.
| experimental_design_assessment.doc |
| exp_design_student_work.pdf |
Collaborative Project
Following the completion of the experimental design unit we began our final unit on probability, concluding with a collaborative project entitled "Casino Day." Students were instructed for two weeks on basic concepts of probability, were to use this knowledge to create a casino game that would be played by their classmates, and each group member would be scored based off of a 100 point rubric (see Casino Day scoring rubric). I wanted the students to work on the casino day project for two reasons. First, this project required students to design and build a finished product and I wanted to see if having the students create an end product produced any changes in engagement and student attitudes when working on a collaborative activity. Second, Casino Day took place during the last week of school and I felt that it would be a fun way to gauge student comprehension of the concepts of probability while at the same time providing one final opportunity to monitor students in a collaborative setting.
Modeling
I modeled two games that I created for the students "Tails Never Fails" and "Spin the Wheel." The two games that I modeled were meant to show the students how they could meet the expectations of the rubric and certain pitfalls to avoid. For example, I made "Tails Never Fails" a simple, boring game and was not enthusiastic when I asked for volunteers to play the game. I also did not calculate the probability distribution and expected value in order to show them where they would lose points. On the contrary, when I demonstrated "Spin the Wheel" I was enthusiastic, had a colorful display, and meet all points of the scoring rubric. I demonstrated both games for the students in this manner so they could see precisely what I would be looking for as I circulated around the room grading each groups project. After the modeling of my games, students were then given a "Casino Day" exploration guideline and the scoring rubric. Each group needed to have a name for their game, probability calculations; i.e. the probability for winning and an expected value that was in favor of the house, a creative design, and a knowledgeable host.
Design and Building Phase
Once students saw both examples they were given three days to create, design, and build their game. Each group member decided on a primary and secondary role: probability calculator, expected value calculator, host, and designer, in order to encourage more student accountability. Each day, I recorded the interactions of the students in my personal journal in order to monitor student attitudes and engagement during this collaborative project now that a finished product would be created and each student had chosen a role within their small group. When I was observing the students, I was looking to see if they were only doing the work of their role or if they were assisting their group members with other aspects of the project. In addition, I was looking to see if they were engaged and listening in on conversations between group members. I noticed that in most groups all of the students were helping out with the tasks that were assigned to them regardless of their chosen roles. For example, most of the students had a hand in the building of the project and with hosting their game. I observed students saying things like, "you're not even going to ask our opinion just going to do it in purple." In addition, when I was sitting with groups and helping them with their probability distributions most members were participating.
Game Day
On the fourth and final day of this collaborative project students were given chips and ten minutes to play each others games. One student from each group went around the room with their chips and played during the ten minute intervals. After each ten minute session, each group counted their chips so that we could keep track of the "big winner." The big winner was the group at the end of the class period that had accumulated the most chips. The host in each group was in charge of advertising their game to potential gamblers. Therefore, each host needed to be enthusiastic and knowledgeable about their games rules and payouts (see casino day rubric). The designs of the games were colorful and as a whole student participation and engagement was high. They seemed to enjoy themselves and I have placed pictures below in a slide show highlighting each groups finished project.
| casino_day_project.docx |
Student Attitudes
In order to investigate my final sub-question (what are the changes in student attitudes during in class activities?) I created a new feedback form that was administered at the end of implementing phase two. At the end of phase one, I realized my student feedback forms failed to address student attitudes during collaborative in-class activities. Thus, during phase two I created a feedback form with two questions intended to gauge student attitudes:
In order to investigate my final sub-question (what are the changes in student attitudes during in class activities?) I created a new feedback form that was administered at the end of implementing phase two. At the end of phase one, I realized my student feedback forms failed to address student attitudes during collaborative in-class activities. Thus, during phase two I created a feedback form with two questions intended to gauge student attitudes:
- Which method of assessment do you prefer: Individual or Collaborative. Why?
- How do you feel about working on group projects and assessments?
